
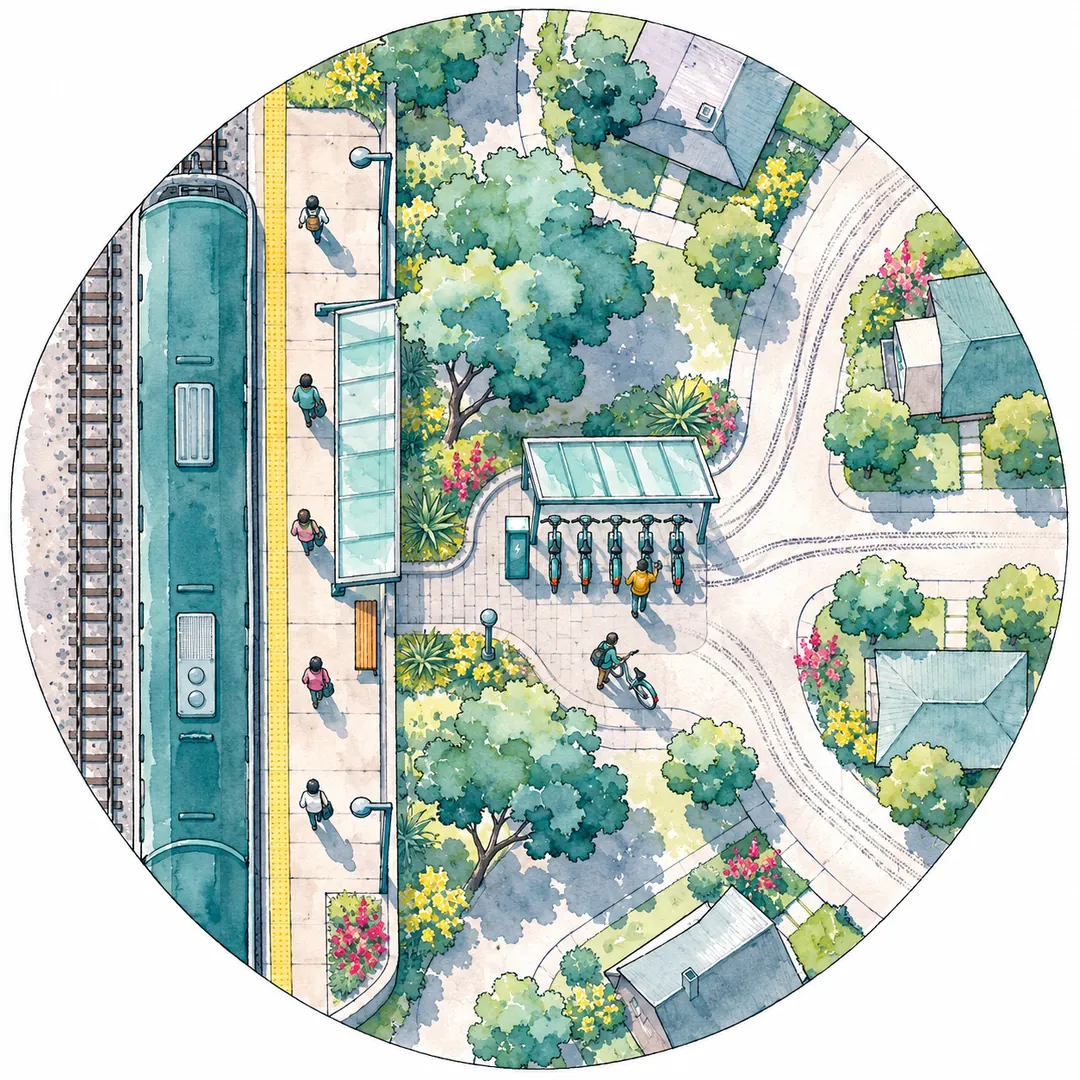
Bike share helps people reach transit when a station sits within a minute’s walk of a stop with frequent service and the ride at the other end is short and safe. Studies find real but modest links: in four California cities an estimated 7.9 to 18.6 percent of bike share trips connected to rail, and in Austin and Chicago researchers judged the relationship between bike share and rail stations weak. For a neighborhood, the working rule is to pair a station at the stop with stations at the homes, jobs or campus about a mile away, joined by a route people will actually ride.
This article is for neighborhood organizations, downtown groups, transit agencies, city planners and developers who want shared bikes to feed buses and trains rather than compete with them. It sets out what the research supports, where it does not, and how a small city with hourly buses, a park-and-ride lot or one commuter stop should place stations. The studies cited are large-city studies, so each finding is translated for a smaller place and labeled where the translation is ours.
What first mile last mile means, and how far a bike stretches it
The first mile is the trip from where you start to the transit stop; the last mile is the trip from the stop you leave to where you are going. Walking covers about a quarter to a half mile of each comfortably, and a bike stretches that reach to roughly 1.2 to 3.1 miles, which is why bike share is proposed as a first mile last mile tool.
The distances come from transportation research and federal policy. Griffin and Sener’s study of Austin and Chicago, published in the Journal of Public Transportation in 2016, notes that people are usually expected to walk to transit about 500 meters to a kilometer, “approximately ¼ to ½ mile.” It adds that bicycling extends the effective access area “to a distance of 2 to 5 kilometers (1.2 to 3.1 miles), depending on the speed of the transit accessed.”
The Federal Transit Administration uses similar figures for funding decisions. Its 2011 policy statement says pedestrian improvements within one-half mile and bicycle improvements within three miles of a stop or station “shall have a de facto physical and functional relationship to public transportation.” FTA based the bicycle radius on research that cyclists “can ride at a pace of approximately ten miles per hour in almost any environment” and “generally are willing to bike at least fifteen minutes to reach a public transportation stop or station.”
The chart shows why the walk becomes the problem somewhere past half a mile. At 1.5 miles, walking takes 30 minutes and a shared e-bike about 9.5, using the default assumptions of the trip time calculator. You can change the speeds and the unlock minutes there for your own streets.
Two terms recur below. An access trip is the ride to a stop; an egress trip is the ride away from a stop after leaving the bus or train. A connection is either one.
Why the two ends behave differently
The two ends of a transit trip are not mirror images. At the home end, riders are spread across many blocks and leave at different times, so one station reaches only the people who live near it. At the destination end, many riders arrive at the same few doors at about the same times, so a station there can fill and empty in waves.
That difference shapes a network. A station at a busy destination stop can serve many riders, while the home end usually needs a station where homes are concentrated, such as an apartment lobby or a neighborhood center, rather than a corner on a quiet street. The California data discussed below fits this pattern: connections concentrated at downtown stations and transfer points, where many trips meet.
What the research shows about bike share and transit
Bike share does connect people to transit, but in most studies it is a minority of trips and the link is weaker than plans assume. The strongest connections show up at busy downtown rail stations and transfer points, on station-based systems, and among riders who already use transit.
Austin and Chicago: a weak link that planning could strengthen
Griffin and Sener examined 2014 trip data and transportation plans in Austin and Chicago. They found that early bike share in North America had been “opportunistic rather than strategic,” and that “Bike sharing use data from both cities suggest a weak relationship with existing rail stations that could be strengthened through collaborative, intermodal planning.”
The numbers show why. About 46.9 percent of Austin’s bike share trips began within 400 meters of a passenger rail station, but the city had “only two rail stations near the B-cycle service area.” In Chicago the share was 44.6 percent. Rider surveys pointed the same way from a different angle: 76 percent of Divvy members surveyed in January 2014 said they used bike share to reach or leave transit “sometimes” or “often,” and 48 percent of Austin respondents said B-cycle made them more likely to use transit.
Four California cities: 7.9 to 18.6 percent of trips connected
A study for the California Department of Transportation by UC Berkeley researchers, report CA21-3298 from June 2021, analyzed 1,191,560 shared micromobility trips from October 2019 to February 2020. It counted a trip as a likely rail connection if it started or ended within 100 meters of a station entrance and met other tests. By that method, “an estimated 18.6 percent, 14.9 percent, 14.6 percent, and 7.9 percent of bikesharing trips connected to and from public transit in San Francisco, Los Angeles, Sacramento, and San Jose, respectively.”
Three details matter for siting:
- Station-based systems connected more. In Los Angeles, 27 percent of station-based trips connected to rail, against 11 to 15 percent for dockless trips. The wider trade-offs are covered in docked, dockless or hybrid bike share.
- Downtown and transfer stations dominated. “The most popular station was often 1) located in the downtown area, or 2) a station where multiple transfers were available.” In San Jose, the main rail depot alone carried 50.8 percent of identified connections.
- Connecting rides were short. Trips identified as connections had a median length of 1,681 meters, about 1.04 miles, and a mean of 2,022 meters.
The authors also give a candid summary: “bikesharing connections to transit are a minority of overall activity and vary with land-use. Most bikesharing activity serves isolated point-to-point travel within the city or even serves as substitution for public transit.” They suggest San Jose’s lower share may reflect “lower population density and the greater auto-orientation of the surrounding land use,” which is the situation many smaller cities share.
The same report surveyed 1,029 Bay Area residents. Among the shared micromobility users in that sample, connections to transit averaged about 1.8 to 1.9 miles depending on how the longest answers were counted, and about half of the 77 responses on travel time reported 15 minutes or less.
Greater Cincinnati: missing connections are the main barrier
Rogers and colleagues at the University of Cincinnati surveyed members of the city’s bike share, with 301 valid responses, published in Urban Rail Transit in 2022. They found that “the major barrier to integrating MUPs into the green transportation system was their lack of connection and availability to transit and bike share,” where MUPs are multiuse paths. Respondents who did not combine modes were more likely to cite “no stations at Origin-Destination” and steep hills.
Interest followed experience. Among respondents who already combined bike share with the bus or paths, 42.9 percent agreed they would use the bus more often if bike share stations “were integrated into more bus stops,” against 22.5 percent of those who did not. Nearly half of those who did not combine modes were neutral on that question.
| Study | Place and data | Main finding for transit | What it means for a small city |
|---|---|---|---|
| Griffin and Sener (2016) | Austin and Chicago, 2014 trips and plans | A weak relationship with rail that planning could strengthen | Stations do not connect to transit by accident; plan the link |
| Caltrans CA21-3298 (2021) | Four California cities, 1.19 million trips | 7.9 to 18.6 percent of trips connected to rail; station-based higher | Expect connections to be a minority of trips; put one station at the stop |
| Rogers and colleagues (2022) | Greater Cincinnati, 301 survey responses | Missing connections and missing stations were the main barriers | Site stations at both ends and connect them to paths |
For scale, NABSA’s State of the Industry page reports that in 2025 “at least 237 million trips were taken on approximately 350,000 shared micromobility vehicles across North America” and says shared micromobility continues to “connect people to transit and destinations.” Its detailed transit figures sit in the full report and a graphic that this article did not use.
What these studies cannot tell you
Each study measured something narrower than its headline. The California analysis tracked vehicles, not people, so the authors note that some trips counted as connections may not have involved transit, and that some riders who walked a little farther to or from a station were missed. Its method also worked for rail stations but not for local buses, which are the service most small cities run.
The Austin data came from a small system near only two rail stations, and the authors say its size “limits statistical evaluation of local conditions.” The Cincinnati survey went to registered members of the bike share, so it describes people who already ride, not the neighbors a new program hopes to reach.
None of these studies covers a town of 10,000 to 70,000 people with hourly buses. Treat the percentages as a range from larger places, not a forecast for yours. The most reliable evidence for your own stops will be a season of your own counts, gathered the way the measurement section below describes.
When bike share competes with transit instead
Bike share can replace transit trips as easily as it feeds them, especially where buses are infrequent or the bike covers the whole trip faster. The Caltrans review found early evidence that station-based bike share may reduce bus ridership while increasing rail use, and the experts it interviewed said competition is more likely where transit coverage is thin.
What the studies found
The Caltrans literature review, again from CA21-3298, summarizes several findings:
- In New York City, Campbell and Brakewood (2017) found that “every thousand bikesharing docks along a bus route was associated with a 2.42 percent reduction in daily unlinked bus trips.”
- In Washington, D.C., Ma and colleagues found that a 10 percent increase in annual bike share ridership contributed to a 2.8 percent increase in average daily rail ridership. Yet 61 percent of surveyed members said they used rail less often after joining, and 4 percent more often.
- Comparing the Twin Cities and Washington, D.C., Shaheen and colleagues suggested that station-based bike share “in larger cities competed with bus systems, but possibly provided first- and last-mile connections to public transit in smaller cities.”
- A 2020 NABSA report, as summarized by the Caltrans authors, averaged user surveys and found that 20 percent of bike share trips substituted for public transit.
The small-city warning
The experts interviewed for the Caltrans study, 19 people from transit agencies, cities, operators, universities and community groups, offered a warning that fits small cities well. Shared micromobility “may be more likely to compete with public transportation if shared micromobility is employed in an environment with limited spatial or temporal coverage,” and it “may offer a more suitable alternative for replacing transit than connecting to an out-of-the-way route with infrequent service.”
In plain terms: if the bus comes once an hour and the destination is two miles away, many riders will skip the bus and ride the whole way. With the default assumptions in the chart above, that two-mile ride takes about 12 minutes door to door.
Is competition bad?
Not always. The same experts suggested that a program’s effect on “private vehicle ownership and use” may matter far more than its relationship to public transit. A bike trip that replaces a half-empty hourly bus is a different outcome from one that replaces a car trip, and a transit agency may welcome some of each. Decide which outcome your program is for before you choose sites, because the answer changes where stations go.
Why small transit systems need a different plan
Most first and last mile research comes from big cities with rail lines and frequent buses. In a small city, transit often means a few bus routes at 30 or 60 minute intervals, a downtown transfer point, a park-and-ride lot or one intercity stop, so stations should serve the few places where many trips meet.
Buses are harder to plan around than trains
The Caltrans method could identify rail connections but not bus ones, because “bus stations are simply too ubiquitous to attribute the termination of a nearby bikesharing trip to a transit connection.” For a small city that cuts both ways. A station next to an ordinary stop will be hard to evaluate, while a station at the downtown transfer point, where every route meets, is easier to plan and to measure.
Example (fictional). In the fictional town of Elk Bend, one bus route runs every 60 minutes past an apartment complex 0.8 mile from the nearest stop, then continues 2 miles to the hospital. A resident who walks to the stop spends 16 minutes walking at 3 mph, then waits for the bus and rides. With a shared e-bike at the trip time calculator’s defaults, the 0.8-mile ride to the stop takes about 6 minutes, but the whole 2.8-mile trip to the hospital takes about 16 minutes with no wait. Many riders will choose the direct ride. If Elk Bend’s goal is fewer car trips to the hospital, that is a success; if the goal is more bus riders, a station at this stop may not deliver it, and the town should look first at stops on more frequent routes. These numbers are hypothetical.
Meadville: a transit agency’s bike share at its own stops
Meadville, Pennsylvania offers a small-city example. The Shared-Use Mobility Center’s profile, revised June 2025, describes a bike share run through the Crawford Area Transportation Authority, with a station near a downtown bus stop and its busiest site at a trailhead. “People can now use CATA buses to get to the trailhead, rent a bikeshare bike once they arrive, and enjoy the trail,” and “Someone can easily make a one-way trip downtown by bike and be able to take another mode back.”
The agency’s hopes are telling for small places. It hoped “that bikeshare stations will improve transportation options for residents, especially in areas with greater bus headways,” and it found that many bike share users “have never ridden a bus, so their first experience with CATA is through the bikeshare program.” In a small city, bike share may be a door into the transit system as much as a feeder to it. The full Meadville story, including how it is funded, is covered in whether bike share works in a small city.
Bikes on buses are a different tool
Some programs lend bikes for days or weeks rather than by the trip, and those bikes may ride the bus. FHWA’s report on Denver’s e-bike libraries found that the larger wheels of fat-tire e-bikes “are incompatible with front-loading bike racks on Denver’s bus system,” and the operator recommends narrower rims “such as the road bike range of 23-28 millimeters” for members who connect to transit. Station-based shared bikes usually stay at the stop instead, which is why a station at each end of the trip matters.
Where to put stations so riders reach the stop
Put the first station where the transit trip begins or ends, close enough that riders can see the stop from the bays, and the second at the cluster of homes, jobs or classrooms about a mile away. Then make sure the route between them is one a cautious rider would choose.
These rules come from the studies above, turned into siting practice:
- Start at the transfer point or the busiest stop. Caltrans found connections concentrated at downtown stations and transfer points, and earlier New York research it cites found the busiest bike share stations “adjacent to large transit hubs.”
- Keep the walk from bay to stop very short. The Caltrans study only counted trips that started or ended within 100 meters of a station entrance as likely connections. Treat that as a reference for what “at the stop” means.
- Cover both ends. Cincinnati riders who did not combine modes pointed to “no stations at Origin-Destination.” One station at a stop with nothing at the far end serves almost nobody.
- Size the far end to about a mile. Connecting rides in the California data had a median of about 1.04 miles, well inside FTA’s three-mile bicycle radius.
- Fix the route, not only the station. Griffin and Sener list “perceived safety, exposure to weather, ownership of bicycles, and available secure parking” as barriers. Bike share solves ownership and parking; the street between the two stations has to solve the rest.
- Keep the stop clear. A station must not block the boarding area, the shelter, the curb ramp or the accessible route. The transit agency will have its own clearance rules.
| Location | When it works | What to check on the walk | Who must agree |
|---|---|---|---|
| Downtown transfer point or rail platform | Several routes meet; riders transfer or finish their trip within a mile | Bays in sight of the boarding area; space that keeps the stop and curb ramp clear; lighting | Transit agency and the landowner; a city agreement if on a public street |
| Stop on a frequent route | Buses at short intervals; destinations 0.5 to 2 miles away | Which side of the street riders arrive on; a safe crossing to the bays | Transit agency; adjacent property owner |
| Stop on an hourly route | Only if the far end has a strong draw, such as a clinic, campus or job site | Whether riders would simply ride the whole trip instead | Transit agency; adjacent property owner |
| Park-and-ride lot | A commuter bus or train serves job sites beyond walking distance at the other end | Stations at the destination end too; power reach in the lot; snow storage | Lot owner, often the transit agency or the state |
| Destination end: job center, campus, clinic | Many riders arrive at the same few times each day | Bays near the main door; secure ground; a route back to the stop | Employer, campus office or property owner |
| Origin end: apartments or a neighborhood center 1 to 2 miles out | Residents ride to the stop in the morning and back at night | Bays by the busiest door; a low-stress route to the stop | Property owner or HOA |
| Trail or multiuse path near transit | The path links the stop to homes or a trailhead | Path lighting and winter maintenance; where bikes leave the path | Trail owner, often a city or park district |
Plan for wind, snow and dark mornings
A stop that works in June can fail in January. In High Plains and Front Range towns, winter commutes start and end in the dark, wind is part of most forecasts, and plows push snow toward the curb where both stops and stations sit.
- Snow. Put the bays where the plow does not pile snow, and agree in writing who clears the pad and the path to the boarding area.
- Light. Light the bays and the walk to the stop; a rider unlocking a bike before sunrise in December needs to see the lock and the curb.
- Wind. Choose a spot sheltered from the prevailing wind, such as the lee side of a building, so riders can wait and parked bikes stay put.
- Season. Decide whether the stop station runs all year. Meadville’s system runs April through November, and a riding season with winter storage is a normal choice; seasonal operations describes the options Colibrino plans for.
Public space comes with approvals
Most transit stops sit on a public street or on transit agency land. Colibrino builds stations on land the host controls or under a city agreement, so a station on a public sidewalk at a bus stop waits for that agreement, and the neighborhood solutions page explains why. A private lot beside the stop, such as a bank’s corner or a church lot, is often the faster first site. A station planning site walk already traces the route from each candidate spot to the nearest street, path or bike lane; near transit, ask for the route to the stop to be traced as well.
Park-and-ride lots, commuter stops and the last mile to work
A park-and-ride lot usually solves the first mile with a car; bike share earns its place at the other end, where the commuter bus or train leaves riders a mile or more from their job. Plan the destination station first, then decide whether the lot needs one at all.
Commuter service in smaller regions often runs a few trips each morning and evening to a larger job center. The trouble is the walk from the drop-off point to an office park or a hospital campus, which may be longer than the bus ride feels worth. A station at the drop-off and another at the job site turns a 30-minute walk into about 10 minutes of riding.
Example (fictional). Riders from the fictional town of Cottonwood Flats take a commuter bus from a park-and-ride lot to a regional center, arriving at 7:35 for shifts that start at 8:00. The office park is 1.5 miles from the drop-off. Walking at 3 mph takes 30 minutes, so riders arrive late; a shared e-bike at the trip time calculator’s defaults takes about 9.5 minutes including unlocking and docking. The plan puts one station within sight of the drop-off and one at the office park’s main entrance. In the morning bikes flow toward the office park, and in the evening they flow back, so the operator checks whether the morning station empties before the last bus. All times and places here are hypothetical.
Two cautions apply. First, a lot owned by a transit agency or a state DOT has its own rules for anything placed on it, so ask early. Second, snow: lots are plowed into piles, and a station in the wrong corner can spend February behind a drift. Mark the snow storage area on the plan before choosing the corner.
New homes near transit: parking, TDM and a station
A developer building near a stop can plan a station into the site from the start, where power, space and the walking route to the stop cost the least. Where the city’s code allows, shared bikes can become one item in the building’s transportation demand management (TDM) plan, the set of measures that help residents travel without a car.
Front Range developers should also check the current parking rules for sites near transit. The explainer on Colorado’s parking minimums and TDM plans covers what the state and Denver require; this section covers only the station.
What to reserve in the design:
- Space by the busiest door. A station by the lobby door residents use most, not behind the building.
- A circuit and conduit. A licensed electrician confirms the circuit; planning the run during construction avoids cutting pavement later. The property developers page describes how a station is planned into a new building, from the circuit on the drawings to the pad by the entrance.
- The route to the stop. If the building is a mile from the stop, the street between them matters more than the station. Ask the city about bike lanes or a path on that route.
- A second station at the stop. If the stop has no station, residents can ride to it but have nowhere to leave the bike. That second site usually needs the transit agency or a neighbor.
Working with the transit agency
A transit agency is the most useful partner a first and last mile station can have. It controls stop locations, schedules, passenger information and sometimes land, and it can fund bicycle access near its stops. It cannot, under FTA rules, use transit funds to buy bike share bicycles.
What a partnership can include
The experts interviewed for the Caltrans study listed integration strategies, from which a small agency and a neighborhood program can borrow:
- Device availability at both ends, “for commuters (e.g., in both urban and suburban areas).”
- Charging near stations, by “installing charging stations for electric devices near public transit stations.”
- App integration and integrated fare payment, ideally with a fare card that does not require a bank account or smartphone.
- Open data. One public sector expert suggested requiring operators to publish their General Bikeshare Feed Specification (GBFS) feeds “so that public transit could integrate real-time micromobility data into third-party apps.”
- Partnerships that present one proposal to the community.
Griffin and Sener suggest writing the link into plans, with goals such as “Bike sharing is accessible at [X number] of local transit stops by [date],” a matching performance measure, and an annual revisit. For a small city that can be one line in the transit plan and one in the bike plan, with the same number in both.
What transit money can and cannot pay for
FHWA’s funding table summarizes FTA’s rules: bicycle projects funded with transit money must be within a 3-mile radius of a stop or station, or within a distance people “could be expected to safely and conveniently bike,” and “FTA funds cannot be used to purchase bicycles for bike share systems.” FTA’s 2011 policy names “bicycle storage facilities” among eligible bicycle access improvements. Highway programs are the usual route for bike share capital; how to fund a bike share or e-bike program explains who may apply and the current Colorado and Wyoming deadlines.
Start with a pair, not a single station
A single station supports only round trips that begin and end at the same bays. That suits a lunchtime errand from an office, but not a commute that starts at home and ends at a stop. For a first transit test, start with a pair: one station at the stop and one at the far end, about a mile away. The programs page compares the ways a station can run, from a resident amenity to neighborhood pay-per-ride, and which one fits depends on who owns each end.
Questions to settle in writing
- Which stops may host a station, and what clearance from the boarding area the agency requires.
- Whether the agency will list the stations in its rider information and maps.
- Who maintains the pad, lighting and snow clearing at the stop.
- What data each side shares, and how often.
How to tell whether stations are helping transit
Count trips that start or end at the station by the stop, compare their timing with bus or train arrivals, and ask riders what the trip included. A small program will not have the data a research team has, but three simple measures answer most of the question.
- Trips at the stop station, by hour. If trips cluster in the minutes before departures and after arrivals, the station is serving transit. The Caltrans team used a 10-minute window before a departure for access trips and after an arrival for egress trips.
- Counts, not only shares. The same report warns that the share of connecting trips “will drop” if a system grows in areas away from transit, “even though there is no aggregate change in transit connecting activity.” Report the number of connecting trips alongside the percentage.
- A two-question rider survey. Ask whether the trip included a bus or train, and what the rider would have done without the bike. That second answer shows whether the station replaced a car trip, a bus trip or a walk.
Reading the numbers after one season
The patterns usually point to one of four situations, each with its own next step:
| What the counts show | What it likely means | What to do |
|---|---|---|
| Many trips at the stop station, few near bus or train times | The station serves the neighborhood more than transit | Keep it; it may still replace car trips. Check the survey before calling it a miss |
| Trips cluster around departures, but the station is empty by 8 a.m. | Demand outruns the bikes at the busy end | Move bikes back to the stop overnight, or add bays at the far end |
| Survey shows many rides replaced bus trips | The bike is faster than the route for those trips | Share the result with the transit agency; it may suit a weak route |
| Few trips anywhere | The far end or the route between the stations is not working | Walk the route again and ask non-riders why |
Moving bikes between stations when one runs empty is routine work; maintenance and rebalancing describes how Colibrino handles it.
Ask any operator for trips by station and by hour; those two cuts are what a transit question needs. Colibrino’s monthly host report lists trips, active riders, bike availability, and issues and fixes, with a CSV export of program data, as described under ride data and reporting. For what a healthy level of use looks like on a small network, see trips per bike per day.
Example (fictional). A fictional downtown association runs two stations: one at the city’s bus transfer point and one by a clinic 1.1 miles away. In its third month, the transfer-point station logs 212 trips, of which 61 start or end within 10 minutes of a scheduled bus. The association reports both numbers, 61 trips and 29 percent, and asks 40 riders a two-question survey. Next season it adds a station at an apartment complex on the other side of the transfer point and watches whether the count of connecting trips rises, even if the percentage falls. All figures are invented for illustration.
What to do next
Start with the stop, the far end and the route between them, then the agreements. A short checklist for a neighborhood or small city:
- Map the transfer points. Mark the stops where routes meet and the stops with the most frequent service.
- Draw a one-mile circle around each. List the homes, jobs, campuses and clinics inside it, and walk the route to the two or three biggest.
- Decide what success means. Feeding transit, replacing car trips, or both. The answer changes which stops come first.
- Talk to the transit agency early. Ask about stop clearances, rider information and data sharing.
- Find land at both ends. A private lot beside the stop is often faster than public sidewalk space, which needs a city agreement.
- Check the times. Run your real distances through the trip time calculator, including your parking and unlocking minutes.
- Plan the count. Agree before launch on trips by station and hour, a 10-minute window and a two-question survey.
The neighborhood mobility section covers related planning, funding and data questions. If you have a site near a stop in mind, you can plan a station; it begins with a site walk.