
Example network: Larkspur Commons, first 90 days
Larkspur Commons is not a real place and not a client. It is a worked example of how Colibrino plans and runs a station network, with every number shown.
For: Property managers and boards who want to see the work before a site walk
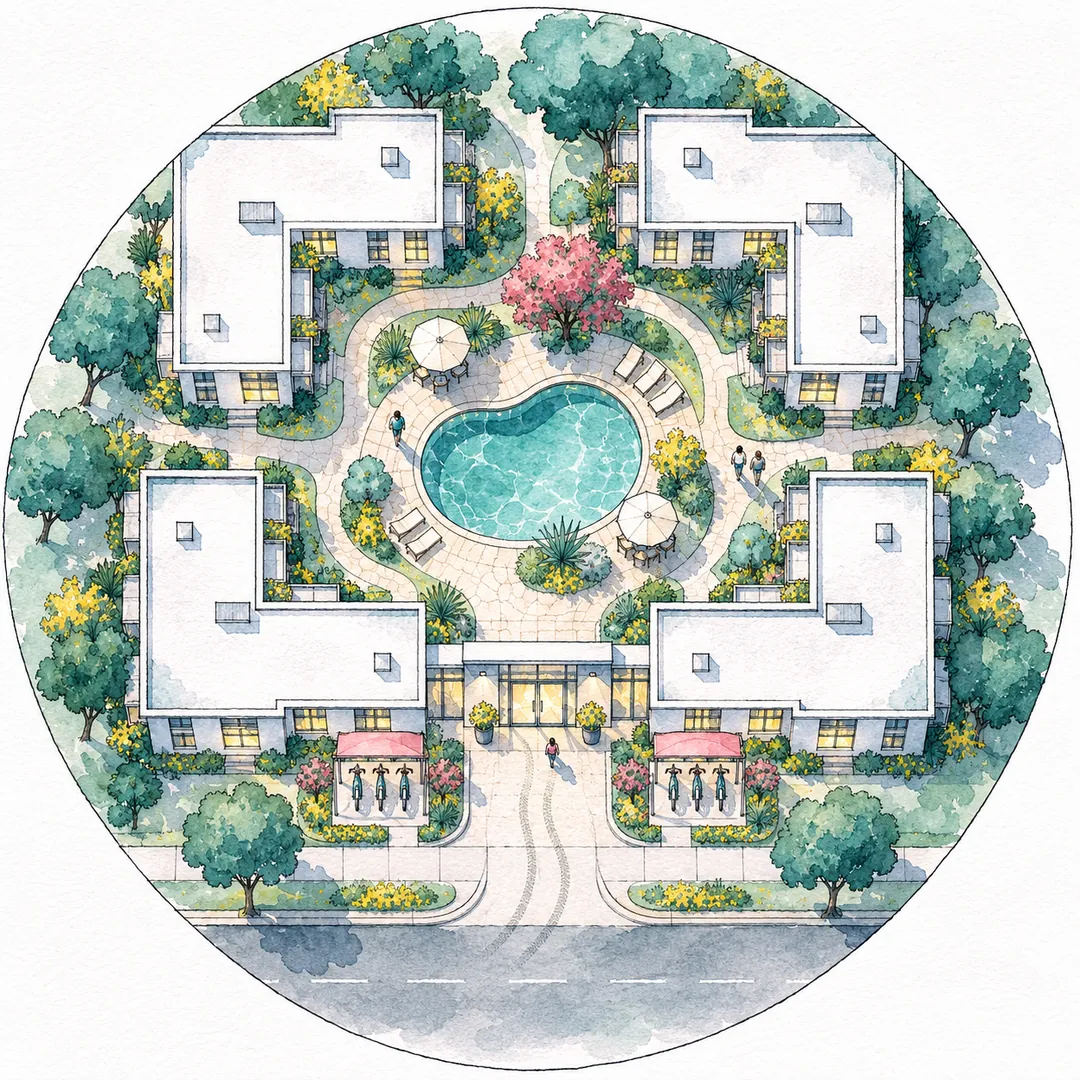
Example (fictional). Larkspur Commons, its manager, its residents and every number on this page are invented. Colibrino is a new company with no stations running yet. This walkthrough shows how the six stages of how we work play out at one property; the rides it lists did not happen.
Larkspur Commons is a fictional 240-home apartment community with about 450 adult residents. Four buildings sit around a courtyard with a pool. Two lobby doors carry most of the foot traffic; a third, quieter door opens toward the pool. The manager wants a resident amenity that keeps e-bike batteries out of hallways.
The days before launch below count from the site walk. After launch, the example counts riding weeks (week 1 is launch week) and the review falls on day 90 after launch.
Day 1: site walk (fictional)
The site walk took place with the community manager. The notes recorded:
- Both lobby doors are used by most residents; each has a paved area beside it that keeps the entry, the ramp and the fire lane clear.
- An exterior outlet near each lobby door, each on its own circuit, to be checked by a licensed electrician.
- The prevailing wind comes across the parking lot; both lobby spots sit in the lee of a building wall. The plow pushes snow to the far end of the lot, away from both spots.
- Both spots are lit at night and visible from the leasing office or a lobby window.
- The pool door is a possible third spot for a later season.
- Rules to work with: the lease, its amenity addendum, and the property insurer’s notice requirements.
The notes came with photos and a power check for each spot.
Day 12: the network plan (fictional numbers)
Example (fictional). The plan sized the network with the same method as the fleet size calculator.
| Plan item | Larkspur Commons (fictional) |
|---|---|
| People who could ride | About 450 adult residents |
| Sign-up assumption | 12%, so 54 members |
| Rides per member per week | 2.5, so 135 rides a week |
| Average day | About 19 rides |
| Busiest day | 27 rides (1.4 times the average day) |
| Rides one bike serves on the busiest day | 2 |
| Bikes | 14 |
| Stations and bays | 2 stations of 8 bays each, 16 bays, beside the two lobby doors |
| Program | Resident amenity: the property pays a monthly program fee and residents ride at no charge |
| Typical trip | 1.8 miles |
| Launch | Install on day 34, launch week on days 35 to 41 |
Fourteen bikes in 16 bays leaves 2 open bays for returning riders. The plan also stated the program fee, which this example leaves out.
Power (fictional numbers)
Each station’s 8 bikes charge on one 20-amp, 120-volt circuit. With every bike charging at once, the load peaks at 800 W, which is 41.7% of the 1,920 W planning limit (80% of the 2,400 W the breaker allows). Each station draws about 1.51 kWh a day. These are the station power calculator defaults. The electrician confirmed both circuits before install.
Electricity for the whole 14-bike fleet comes to about $3.47 per 30 days at an example rate of $0.13 per kWh, from the charging cost calculator defaults. The two figures use different assumptions on purpose: the circuit check assumes heavy daily use so the circuit keeps a margin, while the cost estimate follows the expected 1.8-mile rides.
Rules chosen with the manager (fictional)
- Residents and their guests aged 16 or older who accept the rider terms may ride.
- 10 mph or less on shared paths and in the parking lot; pedestrians first.
- Return every bike to a bay at either lobby station; never leave one in a hallway, stairwell or unit.
- No removing batteries and no charging indoors. Helmets offered at launch.
- Damage, a crash or a battery that smells, swells or smokes goes to the leasing office and Colibrino support right away.
The community e-bike rules builder uses Larkspur Commons as its example.
Winter option (fictional)
The manager chose a full-year program with a reduced winter fleet: from December through February one lobby station stays open with fewer bikes, the other station’s bikes go into storage, and the stored bikes return after a spring inspection.
Day 34 and launch week, days 35 to 41 (fictional)
Both stations were installed and anchored on day 34, and every bay and bike was inspected and recorded. During launch week the manager sent the launch notice and rider rules through the resident portal, Colibrino opened sign-ups, and residents attended two safety sessions in the courtyard.
The first 13 weeks of riding (fictional)
Example (fictional). These ride counts are invented to show how a report reads. Plan: 135 rides a week.
| Week | Rides (fictional) | Note |
|---|---|---|
| 1 | 48 | Launch week |
| 2 | 71 | |
| 3 | 86 | |
| 4 | 98 | |
| 5 | 104 | One bike out of service for 3 days after a flat tire |
| 6 | 112 | One station empty on weekday mornings; 2 bikes moved there each evening |
| 7 | 118 | Same evening moves |
| 8 | 126 | Same evening moves |
| 9 | 131 | |
| 10 | 129 | |
| 11 | 136 | Above the plan |
| 12 | 141 | Above the plan |
| 13 | 133 |
That is 1,433 fictional rides in 13 weeks. Weeks 9 to 13 averaged 134, close to the plan’s 135.
The flat tire (fictional)
In week 5 a rider reported a soft rear tire. The bike was locked out of service, the tire was repaired, and the bike was back after 3 days. The repair went into the service log.
Rebalancing (fictional)
In weeks 6 to 8 one lobby station kept running empty on weekday mornings while the other still had bikes. Each evening, 2 bikes were moved from the fuller station to the one that emptied, so residents leaving for work found bikes waiting. Each move was logged and listed under issues and fixes.
Day 90 after launch: season review (fictional)
The season review looked at the 13 weeks of rides, the morning shortfall at one station and the flat tire. It recommended keeping both stations and adding a third station near the pool door next season, the spot the site walk had noted on day 1.
What the host received each month (fictional)
Each monthly report had the same fields: trips, active riders, bike availability, and issues and fixes, with the service log attached. The manager could export the program data as a CSV file at any time.
| Report | Weeks covered | Trips (fictional) | Issues and fixes listed |
|---|---|---|---|
| Month 1 | 1 to 4 | 303 | Launch week and safety sessions |
| Month 2 | 5 to 8 | 460 | Flat tire, 3 days out of service; evening moves in weeks 6 to 8 |
| Month 3 | 9 to 13 | 670 | Season review on day 90 |
This example does not invent figures for active riders or availability; a real report fills them in from the station’s own records. The ride data and reporting page lists every field.
Try the numbers on your own site
The default values in the fleet size calculator, the station power calculator and the charging cost calculator are this example. Change them to your own homes, residents and circuits to get a first estimate, then plan a station and Colibrino will check the numbers on a real site walk.
Start with one station.
Tell us about the place: how many homes or beds, where people come and go, and where the nearest outlet is. We reply with questions or a time to walk the site with you.